Riverside’s industrial owners face record availability and continued rent pressure, while an empty construction pipeline and stronger investment activity offer reasons to plan beyond the current leasing slowdown.
CoStar’s October 21, 2026 snapshot shows a market still absorbing earlier development and tenant departures. Vacancy is 7.1%, and availability has reached 10.9%. Sales volume has risen approximately 42% YOY, but modeled pricing has increased only 0.8%, underscoring that more trading does not mean every building is appreciating rapidly.
LARGE TENANT DEPARTURES KEEP LEASING PRESSURE ELEVATED
> Vacancy: 7.1%, up from 6.6% at year-end 2025. The increase continues the broader rise from 1.1% at year-end 2022. Tenants still have more alternatives than they did during Riverside’s tightest market.
> Space actually occupied: down approximately 659,000 SF over 12 months. This measure, called net absorption, means move-outs exceeded move-ins. CoStar’s current-quarter reading is positive at 355,315 SF, but this early Q4 snapshot does not establish a sustained turnaround.
> Available space: 10.9%, an all-time high in CoStar’s report. This includes occupied properties being marketed ahead of departures. Availability above vacancy points to further leasing competition if replacement tenants are not secured.
RIVERSIDE INDUSTRIAL VACANCY
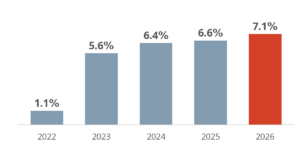
2022-2025: year-end. 2026: October 21 report snapshot. Source: CoStar Riverside Industrial Submarket Report, October 21, 2026.
Jurupa Valley logistics properties contribute to Riverside’s submarket totals. Home Depot plans to vacate a 1.1 million SF building on Venture Drive. Nestlé’s 814,000 SF distribution center on Dulles Drive is being marketed for availability beginning in January 2027.
Conditions vary by property category. Logistics vacancy is 8.8%, compared with 2.3% for specialized industrial properties and 5.6% for flex buildings. Those categories do not define building size, but they demonstrate why large distribution vacancies should not automatically dictate pricing for every smaller property.
Owner Insight: Riverside’s scheduled large-building departures make the next competing listing as relevant as today’s vacancy rate. Track availability dates and comparable building features before setting renewal terms or committing to a leasing budget; a small industrial property’s competitive set may differ substantially from the logistics market.
RENT DECLINES EASE AS THE CONSTRUCTION PIPELINE EMPTIES
> Average market asking rent: approximately $1.06/SF per month, down 0.7% YOY. Rents are still declining, but the latest rate of decline is smaller than the annual drops of 3.1% in 2024 and 1.0% in 2025. This suggests easing pressure, not a confirmed return to growth.
> New supply: approximately 30,100 SF delivered over 12 months. The development wave has slowed markedly: Riverside added 7.2 million SF during 2023 and 2024, with more than 75% subsequently leased.
> Under construction: 0 SF at the October snapshot. CoStar reports no notable project starts since the end of 2023. Future supply pressure has eased, while existing available buildings continue to compete for tenants.
RIVERSIDE MONTHLY ASKING RENT
Market asking rent // $/SF per month
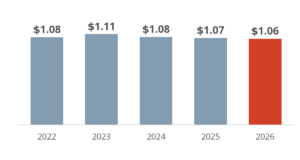
2022-2025: year-end. 2026: October 21 report snapshot. Monthly rents rounded. Source: CoStar Riverside Industrial Submarket Report, October 21, 2026.
Riverside’s challenge has shifted from a wave of new completions toward leasing existing inventory. The report describes weaker demand for older buildings since 2022. Loading, clear height, power, and building condition can determine whether a property competes effectively with newer alternatives.
CoStar forecasts a return to positive rent growth in 2027. That outlook is consistent with a thinner development pipeline, but the forecast is not a guarantee that today’s vacancy has peaked. Owners should base near-term budgets on achievable rents and realistic leasing time.
Owner Insight: With no active construction but 10.9% availability, Riverside’s near-term test is whether tenants absorb the buildings already being marketed. Before funding improvements, identify the specific feature preventing your property from competing with those alternatives; a future supply slowdown alone will not resolve an obsolete layout or loading limitation.
SALES VOLUME REBOUNDS WHILE PRICING MOVES ONLY MODESTLY
> Sales volume: $713.9M across 52 sales over 12 months, up approximately 42% YOY. The prior comparable volume was approximately $503 million, indicating more trading despite softer leasing.
> Modeled market sale pricing: $265/SF, up 0.8% YOY. CoStar’s separate closed-sale average is $288/SF. The modest modeled increase shows that the volume rebound is not equivalent to a broad surge in values.
> Modeled market capitalization rate: approximately 4.9%. CoStar describes cap rates as above their historic lows, reinforcing the need to price against current income and risk.RIVERSIDE
INDUSTRIAL SALES VOLUME COMPARISON
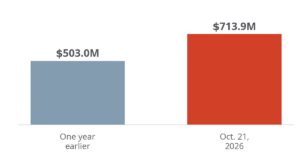
Comparison of 12-month sales volume at the October 21, 2026 report snapshot and the comparable reading one year earlier. Source: CoStar Riverside Industrial Capital Markets Report, October 21, 2026.
Private buyers have represented nearly 45% of Riverside acquisition volume over the past decade. CoStar also notes continued interest in properties with below-market leases, where buyers see potential to increase income as agreements expire.
The largest reported sale over the last year was $223 million, making transaction size relevant when interpreting the $713.9 million total. A small multi-tenant owner should compare similar assets rather than treating investment volume as a direct measure of the property’s appreciation.
Owner Insight: Riverside’s 42% volume increase and 0.8% modeled pricing gain call for separate judgments about market activity and property value. If considering a sale, test the buyer’s assumed future rent against current leasing competition and document the cost and timing of achieving that income.
// LEARN MORE
LOCAL RIVERSIDE PROPERTY MANAGEMENT & BROKERAGE SERVICES
MCG Properties manages and leases industrial, office, and retail properties throughout Riverside. Our local portfolio includes multi-tenant industrial units at Sycamore Business Park in Sycamore Canyon, warehouse and office suites at Riverside Business Park along Chicago Avenue and Durahart Street near UC Riverside and downtown, and retail at Citrus Center on Indiana Avenue near the Riverside Auto Center. This hands-on experience helps us advise owners on tenant demand, property improvements, and leasing strategies grounded in their property’s location and competition.
Want to understand what these trends mean for your property? Request a no-obligation asset valuation. Explore MCG’s Property Management and Brokerage services for support with daily operations, leasing, and sales.
The source CoStar Reports are available to our clients to view and download. Click the links below and then login to the Owner Portal using your credentials.
View the full CoStar Riverside report
View the full CoStar Riverside Capital Markets report
Market data: CoStar Riverside Industrial Submarket Report and Capital Markets Report, dated October 21, 2026. Market rent figures converted from annual to monthly and rounded. Current figures reflect the report date, not a completed Q4.