
Santa Ana’s industrial market is tightening again, but owners will protect more value by focusing on occupancy and lease terms than by assuming rents have returned to their peak.
After several years of tenant move-outs, demand has recovered across the roughly 35.9 million SF Santa Ana industrial market. CoStar reports 4.1% vacancy in Q3 2026, down from a 7.8% peak in 2025. The improvement gives landlords a stronger position, though asking rents are only beginning to stabilize.
Fewer Empty Buildings Give Owners More Room to Plan
- Vacancy: 4.1% in Q3 2026. That is 3.7 percentage points below the 2025 peak. Vacant space is a smaller drag on income, but each available unit still competes on condition and suitability.
- Space actually occupied: up 662,000 SF over the past 12 months. This measure, called net absorption, means tenants took more space than they vacated. It follows earlier years of occupancy losses.
- Available space: 4.9% in Q3 2026. This includes vacant space and space marketed for lease before it becomes vacant. In buildings up to 50,000 SF, availability is around 4%.
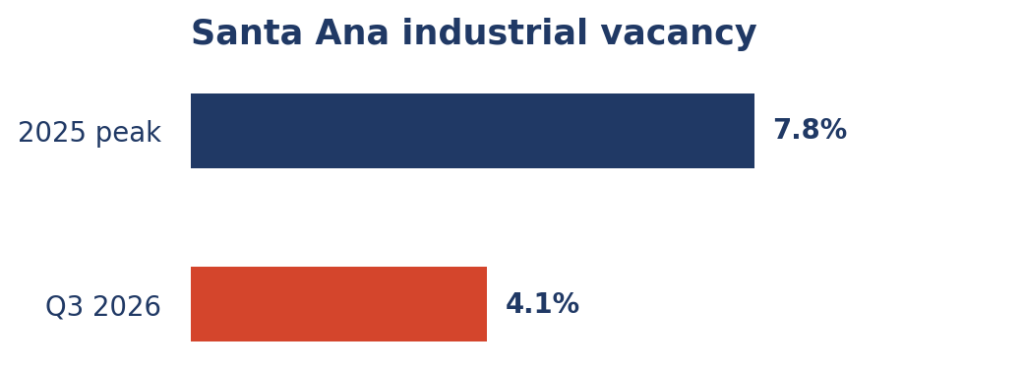
Scale: 0%–10% vacancy. Source: CoStar Santa Ana Industrial Submarket Report, Sept. 24, 2026.
Large users helped shift the market. Anduril Industries leased the three-building South Coast Technology Center, totaling about 311,000 SF, while Cubework signed a 132,000 SF lease in Q1 2026. Those transactions do not mean every smaller unit will lease quickly. They do show that occupiers are again committing to Santa Ana when space fits their operations.
Owner Insight: A renewal that preserves dependable cash flow may create more value than holding out for a higher face rent while a unit sits vacant.
For a 5,000 SF unit, one vacant month at $1.58/SF per month represents roughly $7,900 in potential base rent before expenses and concessions. Owners should compare that real cost with any proposed rent increase, tenant improvement work, and the credit quality of a prospective tenant.
Rents Are Finding Their Footing, While New Supply Remains Limited
- Average market asking rent: about $1.58/SF per month. CoStar’s $19.00/SF annual figure converts to approximately $1.58/SF per month; it describes market asking rent, not the rent achieved on every lease.
- Asking rent growth: down 0.7% YOY. Recent stabilization is encouraging, but an improving vacancy rate has not yet translated into broad rent growth.
- New supply: about 410,000 SF delivered over the past 12 months. At the Q3 snapshot, 112,500 SF was under construction.
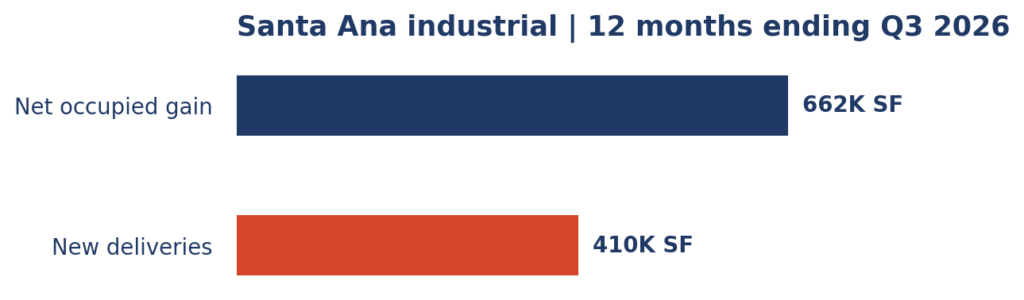
Scale: 0–700,000 SF. Rounded figures. Net occupied gain is net absorption, not the total SF leased. Source: CoStar, Sept. 24, 2026.
Santa Ana has little developable land, which limits the risk of a sustained building wave. CoStar identifies an Amazon distribution project of 112,500 SF under construction on N. Grand Avenue. Proposed projects can change timing or scope; owners should treat them as potential competition, not guaranteed deliveries.
That supply picture supports a measured leasing strategy. Existing landlords should assess loading, power, yard access, office buildout, and deferred maintenance before setting a rent. A well-positioned property can benefit as choices narrow, while outdated space may still require investment or concessions.
Owner Insight: Test the effective rent after free rent, improvements, commissions, and downtime; the asking rate alone does not show the return.
Sales Are Active, but Pricing Depends on the Asset
- Sales volume: $337.4M across 58 sales in the past 12 months
- Closed-sale pricing: $313/SF on average over the same period
- Capitalization rates: 5.6% modeled market rate.
Reported closed transactions with cap-rate data averaged about 6.0%; individual deals vary with income, lease risk, and building quality.
Private investors have accounted for more than 60% of Santa Ana industrial acquisitions over the past decade, according to CoStar. That matters to a family owner considering a sale: likely buyers often scrutinize lease duration, tenant payment history, operating costs, and repair needs as closely as the headline rent.
CoStar describes transaction activity in 2026 as slower than the 2025 rebound, even though the past-12-month total includes that stronger period. The $313/SF average is a useful starting reference, not a valuation for a specific building. A small multi-tenant property near the 5 and 55 freeways may attract a different buyer pool than a newer logistics facility.
MCG manages and leases industrial properties in Santa Ana, including smaller multi-tenant units along Ritchey, Wright, Halladay, and Lyon streets. That local operating view can help an owner weigh a tenant renewal, capital improvement, refinance, or sale against the building’s actual income and competitive set.
Owner Insight: Stronger occupancy improves the conversation with buyers and lenders, but durable income and a credible property-specific plan drive value.
// LEARN MORE
View the full CoStar Santa Ana report
View the full CoStar Santa Ana Capital Markets report
Contact Us
Want to understand what these trends mean for your property? Request a no-obligation asset valuation. Explore MCG’s Property Management and Brokerage services for support with daily operations, leasing, and sales.
Market data: CoStar Santa Ana Industrial Submarket Report and Capital Markets Report, dated September 24, 2026. Market rent figures converted from annual to monthly and rounded.